

PCSPerformance
Climate System
A team culture survey and workshop that show your team’s strengths, where performance can improve and the practical steps to take.
18 focus areas
Measured across six areas
20+ countries
Have used PCS
300 teams
At Reuters, in 14 countries
How it works
- 01
Survey
Anonymous, 15 minutes online, for everyone in the team, including the leader.
- 02
Leader session
A private review of the results with our facilitator, to plan the workshop.
- 03
Team workshop
Facilitated discussion and activities, ending in actions the team agree.
- 04
Your summary
Each team’s results, agreed actions and where more support would help.
The PCS survey measures your team’s climate: what it is like to work in the team day to day. Climate has a strong effect on productivity and wellbeing.
What PCS measures
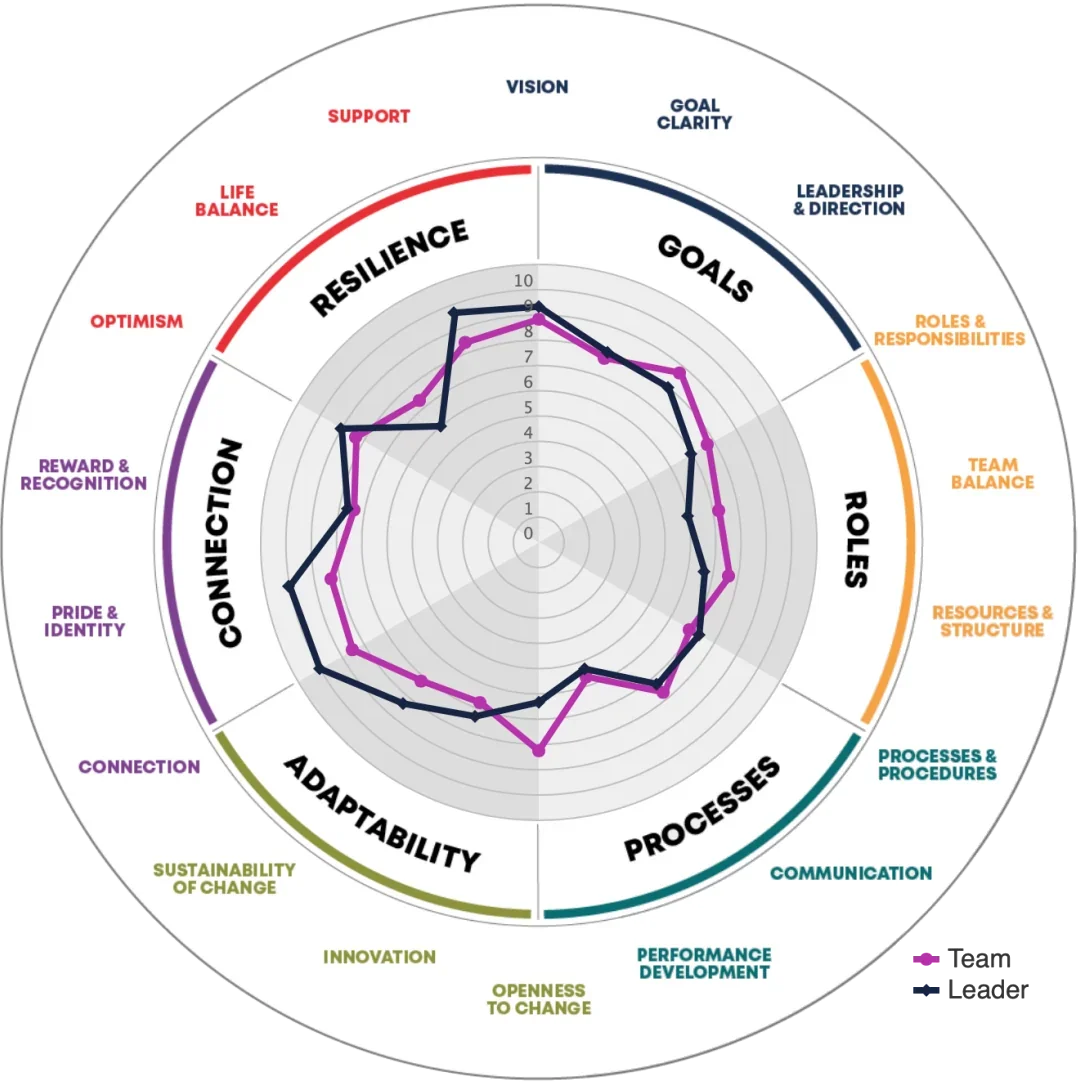
Each team receives a climate score in six areas. These break down into 18 focus areas, which show where the team are strong and where they need work.
Goals
- Vision
- Goal clarity
- Leadership and direction
Roles
- Roles and responsibilities
- Team balance
- Resources and structure
Processes
- Processes and procedures
- Communication
- Performance development
Adaptability
- Openness to change
- Innovation
- Sustainability of change
Connection
- Connection
- Pride and identity
- Reward and recognition
Resilience
- Optimism
- Life balance
- Support
The leader’s view
and the team’s view
PCS compares how the leader rates the team with how the team rate themselves, area by area.
The leader sees this comparison first, in their private session.
Example
What happens in the workshop
The workshop is where the team turn their results into practical solutions.
The team choose the areas that matter most to them and try out better ways of working in experiential activities. The workshop ends with actions the team have agreed together.
The PCS dashboard
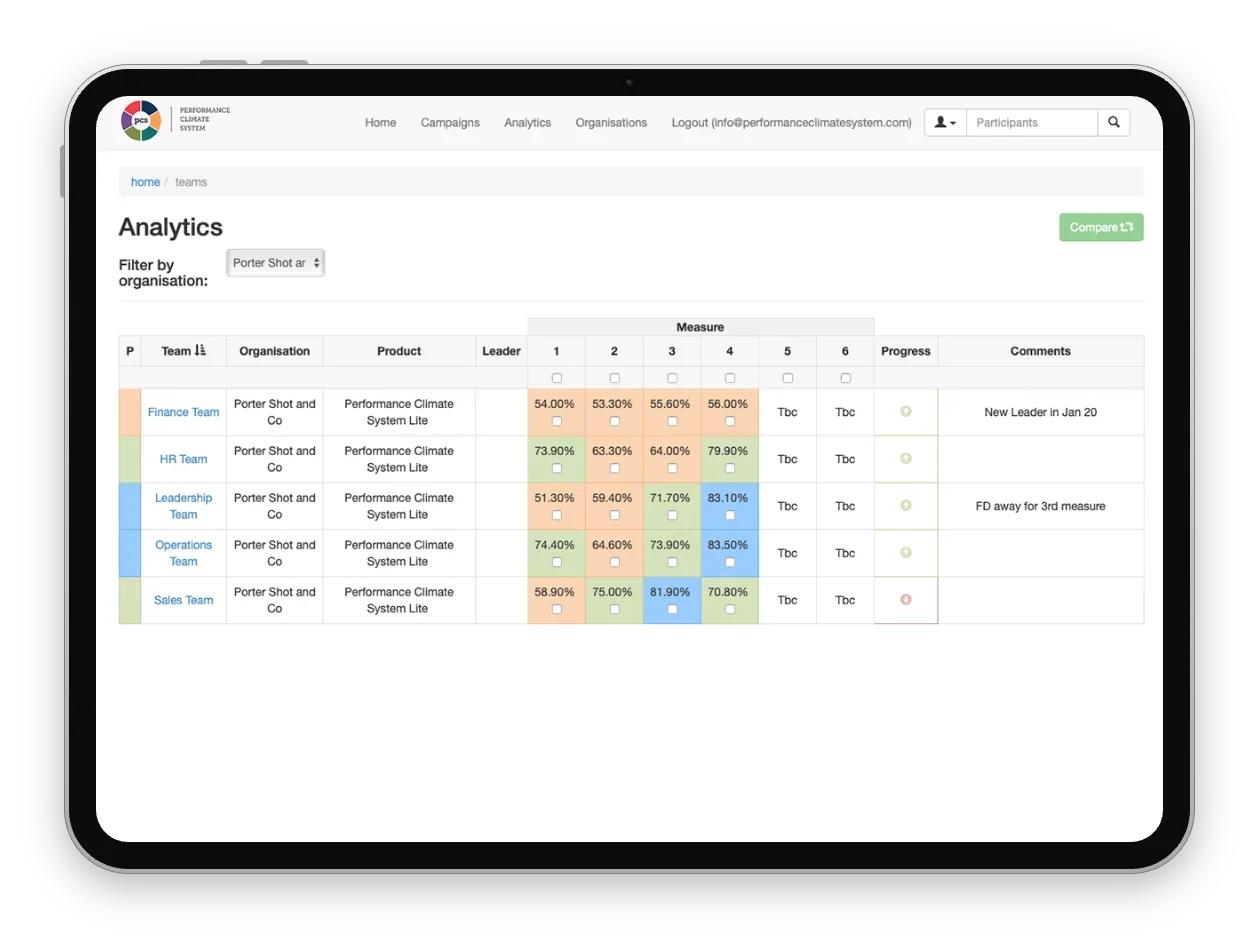
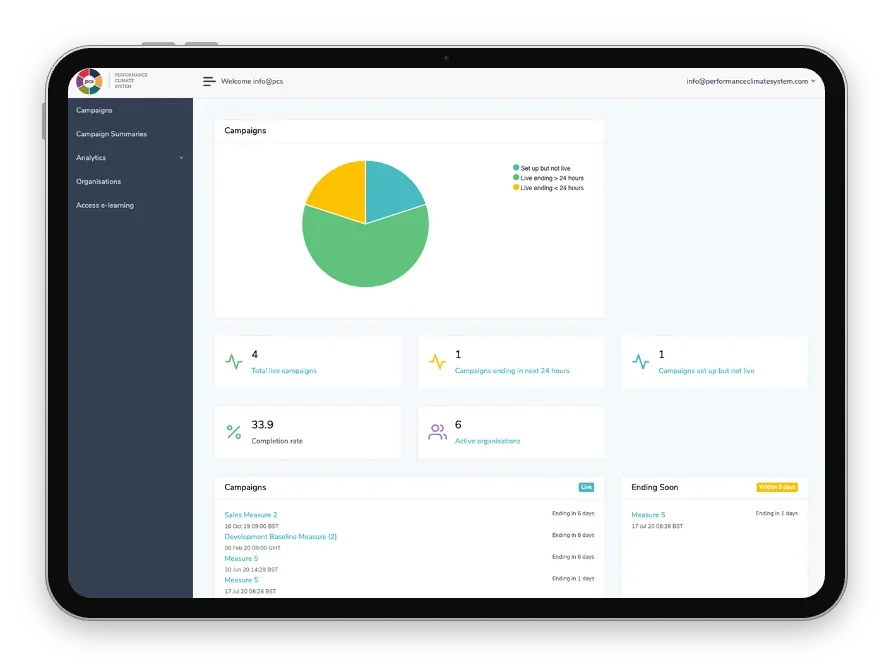
Each team gets its own report. In the PCS dashboard, you see all your teams together in one place.
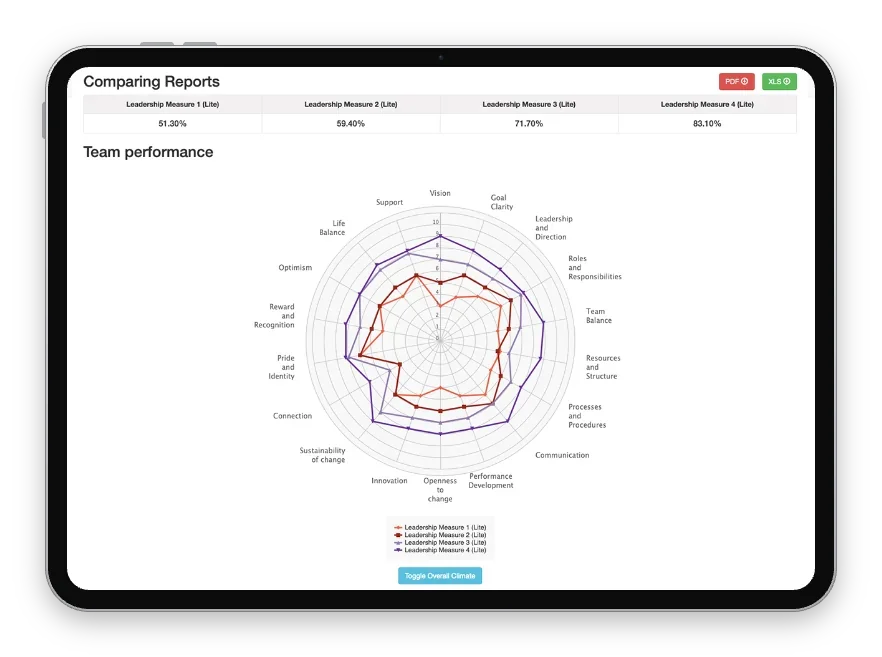
Compare teams and leaders
Each team has one overall score and a score in each of the six areas. You can see which teams and leaders are strong in which areas, so teams that score well can share what works with teams that score lower.
Spot patterns across the organisation
When the same issue shows up in many teams, it points to development the whole organisation needs. This helps you spend your learning and development budget in the right areas.
Track progress over time
When teams repeat the survey, the dashboard compares their scores with earlier rounds, so you can see whether they are improving.
Examples from the PCS dashboard
Organisations that have used PCS
Case study from Performance Climate System
Reuters
Reuters’ customer service teams used PCS throughout three years of development work. Over that time:
- Staff turnover fell from 49% to under 5%, saving £1m
- Sickness absence fell from 12% to 2%, saving £700k
- Reuters made PCS their standard team survey, used in 300 teams across 14 countries
“PCS became fundamental for developing leaders and managing performance. It was included in all team leaders’ annual objectives.”
PCS has been used in more than 20 countries, by organisations including:
- BBC
- NHS
- Maersk
- Ricoh
- Intuit QuickBooks
- Cognisco
- University of Stirling
Get a proposal
Tell us about your teams and what you want to improve. We’ll send you a proposal.
"*" indicates required fields
